Recently a colleague came by and asked whether I could help him with finding out how much memory was already assigned to Oracle databases. It was fun to find out what was exactly he needed and to construct the one-liner bit by bit, as I detail below. When it seemed to work ok, I wrapped it in a small shell script to make it more flexible and reusable and deployed it to all Oracle database servers using CFEngine. You can find the final shell script on Github. I’d suggest you use the shell script instead of the one-liners below, as it is more accurate.

But let’s now play a bit with the shell. Since part of the memory used by Oracle is dynamically assigned, using tools like ‘free‘ will not really help to determine how much memory is allocated. My colleague told me we’d to look at the ‘PGA‘ (Program Global Area) and ‘SGA‘ (System Global Area) values in the Oracle settings of each database.

From the Oracle docs:

The SGA is a group of shared memory structures, known as SGA components, that contain data and control information for one Oracle Database instance. The SGA is shared by all server and background processes. Examples of data stored in the SGA include cached data blocks and shared SQL areas.

A PGA is a memory region that contains data and control information for a server process. It is nonshared memory created by Oracle Database when a server process is started. Access to the PGA is exclusive to the server process. There is one PGA for each server process. Background processes also allocate their own PGAs. The total memory used by all individual PGAs is known as the total instance PGA memory, and the collection of individual PGAs is referred to as the total instance PGA, or just instance PGA. You use database initialization parameters to set the size of the instance PGA, not individual PGAs.

These settings can be found in the ‘spfile*.ora‘ of a given database. This is how I found all of them:

find /oracle/product/*/db_1/dbs/spfile*.ora

Because these are binary data files, so you need ‘strings‘ to get the readable out put. The settings we were looking for had ‘target‘ in their name, so we could grep them out like this:

strings -a /oracle/product/11.x.y.z/db_1/dbs/spfiledbname.ora |\
grep -i target

We’re especially interested in settings that started with ‘*.pga‘ or ‘*.sga‘. Example:

*.pga_aggregate_target=955252736
 *.sga_target=1610612736

Of course, grep can do that too. On the lines we found, the value of the setting (next to the ‘=’) can be in kilobytes (as shown above), but also in megabytes (ending in ‘M’ or ‘m’) or gigabytes (ending in ‘G’ or ‘g’).

The question was: How to quickly sum these values on the command line to get an impression of the assigned memory. My colleagues usually did this by hand, but now there were a bit too many. You shouldn’t do this by hand anyway, if you ask me. So I gave it a try:

First we need to select the correct lines of all ‘spfiles‘ of all databases on a server:

find /oracle/product/*/db_1/dbs/spfile*.ora |\
xargs strings -a |\
grep target |\
grep -iE '\*.[ps]ga'

This resulted a list of all the settings we were looking for. The same as above, but for all databases, one per row. The next thing to do, to be able to sum them up, is to remove everything except the values we want to sum. The command ‘cut’ can do this, using a delimeter ‘=’ and then the second field. It looks like this:

find /oracle/product/*/db_1/dbs/spfile*.ora |\
xargs strings -a |\
grep target |\
grep -iE '\*.[ps]ga' |\
cut -d= -f2

It returned all kind of different values, like:

1500M
2g
754974720
2G
351272960
2g
2561671168

To sum them, one needs to convert everything to be of the same order. In this case values without a postfix were in kilobytes, so we should convert gigabytes and megabytes to kilobytes. Since I’d need a calculator later on anyway, I used ‘sed‘ to convert these values as shown below:

find /oracle/product/*/db_1/dbs/spfile*.ora |\
xargs strings -a |\
grep target |\
grep -iE '\*.[ps]ga' |\
cut -d= -f2 |\
sed -e 's/G/*1024*1024*1024/gi' |\
sed -e 's/M/*1024*1024/gi'

This results in:

1500*1024*1024
2*1024*1024*1024
754974720
2*1024*1024*1024
351272960
2*1024*1024*1024
2561671168

For this to be calculated with ‘bc‘, we need it all on one line and ‘+’ between the rows. That step can be done with the command ‘paste‘. We want all values to be on one line (-s) and use ‘+’ as a delimiter (-d):

find /oracle/product/*/db_1/dbs/spfile*.ora |\
xargs strings -a |\
grep target |\
grep -iE '\*.[ps]ga' |\
cut -d= -f2 |\
sed -e 's/G/*1024*1024*1024/gi' |\
sed -e 's/M/*1024*1024/gi' |\
paste -s -d+

This results in:

1500*1024*1024+2*1024*1024*1024+754974720+2*1024*1024*1024+351272960+2*1024*1024*1024+2561671168

Final step is to feed this calculation to ‘bc’ and you’re done:

find /oracle/product/*/db_1/dbs/spfile*.ora |\
xargs strings -a |\
grep target |\
grep -iE '\*.[ps]ga' |\
cut -d= -f2 |\
sed -e 's/G/*1024*1024*1024/gi' |\
sed -e 's/M/*1024*1024/gi' |\
paste -s -d+ |\
bc

This results in:

11683233792

If you want to convert it to display gigabytes instead of kilobytes, add this ‘awk‘ command to instruct ‘bc‘ to divide and display two decimals (otherwise it will floor down the value):

find /oracle/product/*/db_1/dbs/spfile*.ora |\
xargs strings -a |\
grep target |\
grep -iE '\*.[ps]ga' |\
cut -d= -f2 |\
sed -e 's/G/*1024*1024*1024/gi' |\
sed -e 's/M/*1024*1024/gi' |\
paste -s -d+ |\
awk {'print "scale=2; (" $1 ")/1024/1024/1024"'} |\
bc

This results in:

10.88

This means 10.88 GB of memory has been allocated to databases.

A nice example of the power of the Linux shell 🙂

The WordPress.com stats helper monkeys prepared a 2013 annual report:

Here’s an excerpt:

My blog was viewed about 220,000 times in 2013, which is a 733% increase over last year. On the last day of the year we even reached a quarter of a million total views! 🙂

Visitors came from 199 different countries this year. The busiest day of the year was March 19th with 1,640 views. The most popular post that day was Building an always available Linux terminal: Shell-In-A-Box on Raspberry Pi, that was featured on Linux Today.

Click here to see the complete report.

2013 was an interesting year for me: I had a challenging job to do in an enterprise Linux environment. I’m proud to announce I was already able to automate myself out of it. Come see my FOSDEM talk at February 1st and I’ll tell you all about it. The talk will be in the Configuration Management Room.

Thanks to all visitors, especially the ones that left their comments: I appreciate it!

See ya in 2014! 🙂

Now that I’m using CFEngine for some time, I’m exploring more and more possibilities. CFEngine is in fact a replacement of a big part of our Zenoss monitoring system. Since CFEngine does not only notice problems, but usually also fixes them, this makes perfect sense.

Recently I created a promise that monitors the disk space on our servers. Since we use Logstash to monitor our logs, all CFEngine needs to do is log a warning and our team will have a look. I will write about Logstash another time 😉

To monitor disk space, I use two bundles: one that is included from ‘promises.cf’ and a second one that is called from the first one.

The ‘diskspace’ bundle looks like this:

bundle agent diskspace
{
        vars:
                "disks[root][filesystem]"         string => "/";
                "disks[root][minfree]"            string => "500M";
                "disks[root][handle]"             string => "system_root_fs_check";
                "disks[root][comment]"            string => "/ filesystem check";
                "disks[root][class]"              string => "system_root_full";
                "disks[root][expire]"             string => "60";

                "disks[var][filesystem]"          string => "/var";
                "disks[var][minfree]"             string => "500M";
                "disks[var][handle]"              string => "var_fs_check";
                "disks[var][comment]"             string => "/var filesystem check";
                "disks[var][class]"               string => "var_full";
                "disks[var][expire]"              string => "60";

 		apache_webserver::
	                "disks[webdata][filesystem]"          string => "/webdata";
	                "disks[webdata][minfree]"             string => "1G";
	                "disks[webdata][handle]"              string => "webdata_fs_check";
	                "disks[webdata][comment]"             string => "/webdata filesystem check";
	                "disks[webdata][class]"               string => "webdata_full";
	                "disks[webdata][expire]"              string => "60";

		someserver01::
	                "disks[tmp][filesystem]"          string => "/tmp";
	                "disks[tmp][minfree]"             string => "1G";
	                "disks[tmp][handle]"              string => "tmp_fs_check";
	                "disks[tmp][comment]"             string => "/tmp filesystem check";
	                "disks[tmp][class]"               string => "tmp_full";
	                "disks[tmp][expire]"              string => "30";

        methods:
                "disks"                           usebundle => checkdisk("diskspace.disks");

}

All it does is define the configuration, depending on the classes that are set. Some are disks monitored on all servers (like ‘/’ and ‘/var’ in this example) and some are monitored only when the specified class is set (like ‘apache_webserver’ and ‘someserver01’). These are classes I defined in ‘promises.cf’ based on several custom criteria.

The ‘checkdisk’ bundle does the real job:

bundle agent checkdisk(d) {
        vars:
                "disk"  slist => getindices("$(d)");

        storage:
                "$($(d)[$(disk)][filesystem])"
                        handle => "$($(d)[$(disk)][handle])",
                        comment => "$($(d)[$(disk)][comment])",
                        action => if_elapsed("$($(d)[$(disk)][expire])"),
                        classes => if_notkept("$($(d)[$(disk)][class])"),
                        volume => min_free_space("$($(d)[$(disk)][minfree])");
}

Although this may look cryptic, it is a nice and abstract way to organize the promise. This is ‘implicit’ looping in action: if the ‘disk’ variable contains more than one item, CFEngine will automatically process the code for each item. In this case, this means a promise is created for all the disks specified.

If you prefer a percentage, instead of fixed free size, you could use ‘freespace’ instead of ‘min_free_space’ in the ‘checkdisk’ bundle.

When a disk is below threshold, this log message is written:

2013-11-01T17:35:42+0100    error: /diskspace/methods/'disks'/checkdisk/storage/'$($(d)[$(disk)][filesystem])': Disk space under 2097152 kB for volume containing '/' (802480 kB free)
2013-11-01T17:35:42+0100    error: /diskspace/methods/'disks'/checkdisk/storage/'$($(d)[$(disk)][filesystem])': Disk space under 2097152 kB for volume containing '/tmp' (1887956 kB free)

Apart from reporting, you could even instruct CFEngine to clean up certain files when disk space becomes low or to run a script. You would then use the specified ‘class’ that is set when the disk has low free disk space (‘tmp_full’ for example). Anything is possible!

Red Hat Certified EngineerLast week I attended the Red Hat RH300 course (fast track) in Amsterdam and did the RHCSA and RHCE exams on the final day. I passed both RHCSA (283/300 points) and RHCE (300/300 points). I had a great teacher because, apart from technical stuff, I also learned how to approach the exams.

The objectives for both RHCSA and RHCE are well documented on Red Hat’s site. You should start to make sure you know everything inside out. Practise, practise, practise. Learn to use the documentation that ships with RHEL, as this is the only help available: no internet access is provided during the exam. There are several books available that help prepare and Red Hat has very good courses as well, that I really recommend. I assume you should be able to study this all one way or the other.

One advise on this though: don’t try to remember everything but remember the references instead. If you know a man page has examples you can use, just remember the man page. If you know documentation is in a separate package, remember the package name. A references takes less ‘memory’ in your head, so you can remember more. This will speed up your work significantly.

But wait, technical knowledge is just one challenge. Watch out for the pitfalls:

Pitfall #1: Time
Most experienced Linux sysadmins will probably be able to pass the exam if there was no restriction on time. You could test, trial-and-error and read man pages all day long. Even start from scratch when you seriously broke something. Well, it’s time to wake up: in reality time on the exam is (very) limited. And yet many candidates do not manage their limited exam time.

A classic example: spending too much time on something that does not work right away. Instead, accept the fact it doesn’t work now and continue with other tasks or else time will run out. When you have given everything a first attempt, you can always return to a task that you skipped before.

Not only should you know immediately what to do when you read the tasks, you need to know the fastest way to configure something. Yes, the fastest way. Not the way you prefer to do it, or have been doing it until now. I’ve heard people complaining about the GUI/TUI tools. And I agree a GUI is not something you want on a server. But hey, if ‘system-config-authentication‘ has a ready to fill-in form and makes you configure LDAP with TLS and Kerberos in 60 seconds. Why would you want to go for the manual way on the exam? Yet, some feel they are better off configuring this on the command line. There’s simply no time for that approach, nor will it bring in more points. Be smart, take the fast track.

Pitfall #2: Your assumptions
Reading is a big problem because candidates tend not do read very well on the exam. Especially when aware of Pitfall #1, they will not spend the first few minutes reading instructions. A waste of time, right? But in reality this will cost precious time later on because assumptions are made, but never checked. Is it a good idea to start working on something, without seeing the bigger picture?

I don’t think so. Sometimes, tasks are related but not grouped together. When you read everything first, you might find that doing two tasks together is easier. Or you might choose a different approach based on all information, instead on just a single task. Reading ahead helps you understand the bigger picture.

Imagine you are asked to configure, let’s say, NTP. Some assume they have to sync to a time source that is provided and then have to setup a NTP server and serve time to the local network. But isn’t is a waste of time to configure a NTP server, when all you have to do is setup a NTP client? This also occurs with tweaking configurations more than is being asked for. Keep it simple and do exactly what is asked for.

How I avoided the pitfalls
Value your own work through the eyes of a customer. Example: if a web server is perfectly configured but a firewall prevents access to it, then this does not work for a client. Website is down: zero value. Red Hat might also values your work on the exam like this. Keep that in mind.

Structure is another important thing to work on. This was my approach on the exam:

1. Imagine you are working for a client that has written down everything they want from you. Read it all and try to understand the bigger picture. Then reorganize it: group together what belongs to each other.

2. Install everything at once. After step 1 you should have identified all packages you need to install. Do it now. Then ‘chkconfig on‘ every service you will configure later. Why? Because it is easy and it prevents forgetting it later on. Remember: a perfectly configured service that does not start at boot brings in zero points.

3. Then setup the firewall for the services you identified at step 1 and installed at step 2. You probably need to tweak this as you go through the tasks, but just setup the basics now. This will make it easier later on.

On my exam the first 3 steps took less than 20 minutes and provided a solid base to build on.

4. Work through all tasks and remember: Be smart, take the fast track. Also, skip any task that you are stuck on for more than 10 minutes.

Reboot a few times and recheck everything you have finished so far. Your work is reviewed after a reboot anyway, so you should make sure your changes survive a reboot. The sooner you find a problem, the sooner you will be able to solve it.

5. When everything is done, carefully check the items a final time. Then you’re done. And, you probably have some time left!

Conclusion
The Red Hat exams are challenging. You absolutely need the technical skills as outlined in the objectives. But, I believe that alone is not enough. To pass, you should manage your limited time on the exam by taking the fast track and remember the right references. Before you start, make sure to have a clear picture in mind of what you are supposed to do. Start by building a basic setup and work from there. Finally, always check your assumptions.

Good luck! 🙂

Back in June, just before I went off for holiday, I attended a CFEngine training in Amsterdam. When I returned from holiday a few weeks later, me and my team started making plans to implement CFEngine in our environment. After two months of hard work, I’m proud to say we manage about 350 out of our 400 Linux servers with CFEngine!

The ride has been fun, although not always easy. In this post I’ll give a quick overview of our CFEngine implementation, where I found useful info, etc.

CFEngine is different
To start, let me tell you that one of the most difficult parts of learning CFEngine is to get used to the terminology and to ‘think’ CFEngine. For example, a ‘class’ in CFEngine is not what you think it is. It has nothing to do with object oriented programming. It’s more like a ‘context’ that you can use to make decisions. There’s no ‘flow control’ in CFEngine either: no IF/THEN/ELSE, no FOR/FOREACH/WHILE etcetera. In CFEngine classes are used for decision making, and, since CFEngine is smart, it does looping automatically. This results in clean and easy-to-read code.

CFEngine works on top of a theoretical model called ‘Promise Theory‘ by Mark Burgess (author of CFEngine). This theory models the behavior of autonomous agents in an environment without central authority, based on only promises of behavior made by each agent, and shows that even without central control , the system can converge to a stable state.

To get used to it, read ‘Learning CFEngine 3‘ by Diego Zamboni, as it will walk you through all of it with a lot of examples. The quote above is also from the book.

The basic idea is that each agent makes promises only about its own behavior, since that is all it can control. In CFEngine 3, everything is a promise.

Examples:
– a file promises to have a certain content and to be executable
– a service promises to be running
– a user account promises to exist (or not to exist) and have certain properties

When CFEngine finds a promise is not kept, it will do everything it knows about to make the promise true. If it cannot reach the promised state at first, it tries to the next best. Over time, the system converges to the desired (promised) state.

Once you get it and get used to it, it actually makes sense and is pretty easy to implement.

With great power comes great responsibility
This one-liner says it all. When you have a configuration management system that manages a lot of servers, you better be careful what promises you have it keep. This is why you need to manage CFEngine promises like software. You need version control and it needs to be flexible as well. I’ve read a lot about this subject and I believe Git is the way to go. This blog by Brian Bennett pretty much nails it. I got a lot of inspiration from it, thanks Brian!

I implemented these ‘branches’ in Git:
– development (aka master)
– beta
– pre-production
– production

This works perfectly: develop new promises in the ‘development’ branch, then merge to ‘beta’ branch to test on some of our own test servers. When everything works together and seems stable, we merge to the next branch ‘pre-production’. This is then tested on ~15 real production servers so it better be good. But when it isn’t, the impact is still not too high and it should be fixed before it ever hits ‘production’. Production branch is everything that is stable and is used on all ~350 servers.

Every time we merge to either ‘pre-production’ or ‘production’, we create a Git ‘tag’ with a date, that allows for easy roll backs. Whenever we need to get back to a certain state, we can always just checkout a tag. This is also very useful for audit trails, by the way.

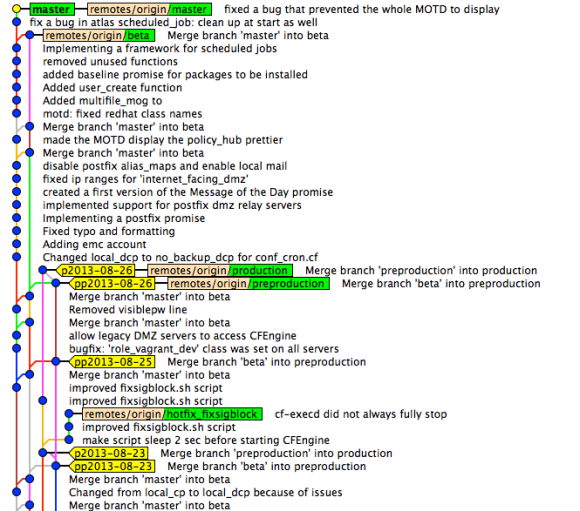
Actually, we’re using another branch called ‘hotfix’. Whenever there’s an emergency to fix, we branch a ‘hotfix’ from ‘production’ and do the fix. This is for example when a promise misbehaves. This branch is then merged to production when ready, and also to ‘development’. Git handles this nicely: whenever the hotfix makes it all the way from ‘development’ to ‘production’, Git recognizes this commit was already processed earlier and ignores it.

Git commits, branches and tags in CFEngine repo

Git commits, branches and tags in CFEngine repo


This is a screenshot from ‘Gitk’ that shows the commits, branches (green) and tags (yellow). As you can see, ‘production’ and ‘pre-production’ are at the same level now, so nothing new is tested in ‘pre-production’ at the moment. Quite some work is tested in the ‘beta’ branch and there are already some fixes committed in ‘master’. Recently there was a ‘hotfix’ branch that has now been merged. It should give an idea of how it works. It provides a clear overview and we now know about every change on the configuration of our servers. Clicking on a commit show what changed, who did it, etc.

CFEngine Policy hubs
For each of the 4 branches we’ve created a CFEngine policy hub. The policy hub is a server running CFEngine software that serves the given branch to the agents (the Linux servers connected to it). Linux servers can even switch between them by ‘bootstrapping’ to one of the 4 policy hubs. Although we only use that on our test servers.

Manage what’s ‘in flight’ with a CFEngine Trello board
Trello provides an intuitive and modern web interface that allows you to manage ‘cards’ on different ‘lists’ on a ‘board’. To get an idea, see the example Trello board below (click on it to enlarge).

Trello CFEngine board

Trello CFEngine board


New cards are usually created in ‘Feature requests’ or ‘Bugs’ and then transferred to ‘Working on it!’. The number of cards in this stage should be limited, as you can only work on a number of things at the same time. This is actually Kanban style. Next, we’ve created a list for each Git ‘branch’ we have and cards flow from ‘beta’ to ‘pre-production’ and finally ‘production’. Moving cards is just dragging & dropping. Each month, cards in ‘production’ are archived. This creates an overview of what new work is to be done (‘Feature requests’ and ‘Bugs’), what we’re currently working on and what’s in each of the branches. Trello has the overview, Git has the code and the details. Also, Trello is perfect for communication between team members. Notes, comments, documents, lists, etcetera can all be created with ease.

Testing promises
To be able to test the promises on our local laptops, we’re using a tool called Vagrant. Vagrant sets up Virtual Machines (for example using Virtual Box) and allows you to ‘destroy’ and ‘create’ them within minutes. All team members have a local Git checkout, that is also available in the Vagrant boxes. This allows us to test any change before even committing. We have Vagrant boxes setup for all Linux distributions we support. It’s so easy and so fast to test changes that everybody does. And even when an error slips through, other team members will soon notice and it’s usually fixed within minutes, before it ever hits the ‘beta’ branch.

Bugs
We encountered a strange bug when using SLES 11 and CFEngine 3.5: CFEngine (community edition) got running with the ‘SIGPIPE’ signal blocked. When CFEngine restarts SSH, this too gets running with ‘SIGPIPE’ blocked. This results in ‘sudo’ no longer working. It would just return nothing at all. It took us quite some time to figure out it was the ‘SIGPIPE’ signal that was blocked. The root cause probably lies in an old ‘Bash’ version (3.51) that SLES uses, combined with something CFEngine triggers. We’ve now implemented an automated work-around (made a CFEngine promise) that fixes the problem. We did some nice team work on this one!

Conclusion
CFEngine’s learning curve might be steep, but the result is definitely rewarding. Combined with Git and Trello it allows for fine control and great overview of configuration changes. Our whole team is involved in changes, they are reviewed and result in high quality code. This eventually makes the Linux servers we manage more stable. Also, it’s a great feeling to be in-control and know what’s going on our servers.

From this point on, we’ll continue to both scale horizontally (add more servers) and vertically (add more promises). After two months of daily working with CFEngine, I’ve to say I really like it and I enjoy writing promises.

I’ll keep you posted, I promise 😉