Archives For 30 November 1999

I’m currently finalizing the CFEngine 3 setup at my $current_work because by the end of the month I will start a new job. In a little over a year, I fully automated the Linux sysadmin team. From now on, only 2 sysadmins are needed to keep everything running. Since almost everything is automated using CFEngine 3, it’s very important that CFEngine is running at all times so it can keep an eye on the systems and thus prevent problems from happening.

I’ve developed an init script, that makes sure CFEngine is installed and bootstrapped to the production CFEngine policy server. This init script is added in the post-install phase of the automatic installation. This gets everything started and from there on CFEngine kicks in and takes control. That same init script is also maintained with CFEngine. This is done so it cannot easily be removed or disabled.

Also, when CFEngine is not running (anymore) it should be restarted. A cron job is setup to do this. This cron job is also setup using CFEngine. It is using regular cron on the OS, of course. If all else fails, this cron job can also install CFEngine in the event it might be removed. Last thing it does, is automatically recover from ‘SIGPIPE’ bug we sometimes encounter on SLES 11.

To summarize:
– an init script (runs every boot) makes sure CFEngine is installed and bootstrapped
– a hourly cron job makes sure the CFEngine daemons are actually running
– CFEngine itself ensures both the cron job and init script are properly configured

This makes it a bit harder to (accidentally) remove CFEngine, don’t you think?!

Reporting servers that do not talk to the Policy server anymore
Now, imagine someone figures a way to disable CFEngine anyway. How would we know? The CFEngine Policy server can report this using a promise. It reports it via syslog, so it will show up in Logstash. The bundle looks like this:

bundle agent notseenreport
{
        classes:
                "display_report" expression => "Hr08.Min00_05";

        vars:
                # Default to empty list
                "myhosts" slist => { };

                display_report::
                        "myhosts" slist => { hostsseen("24","notseen","name") };

        reports:
                "CFHub-Production: Did not talk to $(myhosts) for over 24 hours now";
}

We’ve set this up on both Production and Pre-Production Policy servers.

How to temporary disable CFEngine?
On the other side, sometimes you want to temporary disable CFEngine. For example to debug an issue on a test server. After a discussion in our team, we came up with an easy solution: when a so-called ‘Do Not Run‘ file exists on a server, we should instruct CFEngine to do nothing. We use the file ‘/etc/CFEngine_donotrun‘ for this, so you’d need ‘root‘ privileges or equal to use it.

In ‘promise.cf‘ a class is set when the file is found:

"donotrun" expression => fileexists("/etc/CFEngine_donotrun");

For our setup we’re using a method detailed in ‘A CFEngine Case Study‘. We added the new class:

!donotrun::
        "sequence"  slist => getindices("bundles");
        "inputs" slist => getvalues("bundles");

donotrun::
        "sequence"  slist => {};
        "inputs" slist => {};

reports:
   donotrun::
        "The 'DoNotRun' file was found at /etc/CFEngine_donotrun, exiting.";

In other words, when the ‘Do Not Run‘ file is found, this is reported to syslog and no bundles are included for execution: CFEngine then does effectively nothing.

An overview of servers that have a ‘Do Not Run‘ file appears in our Logstash dashboard. This makes them visible and we look into then on a regular basis. It’s good practice to put the reason why in the ‘Do Not Run‘ file, so you know why it was disabled and when. Of course, this should only be used for a small period of time.

Making sure CFEngine runs at all times makes your setup more robust, because CFEngine fixes a lot of common problems that might occur. On the other hand, having an easy way to temporary disable CFEngine also prevents all kind of hacks to ‘get rid of it’ while debugging stuff (and then forgetting to turn it back on). I’ve found this approach to work pretty good.

Update:
After publishing this post, I got some nice feedback. Both Nick Anderson (in the comments) and Brian Bennett (via twitter) pointed me into the direction of CFEngine’s so called ‘abortclasses‘ feature. The documentation can be found on the CFEngine site. To implement it, you need to add the following to a ‘body agent control‘ statement. There’s one defined in ‘cf_agent.cf‘, so you could simply add:

abortclasses => { "donotrun" };

Another nice thing to note, is that others have also implemented similar solutions. Mitch Lewandowski told me via twitter he uses a filed simply called ‘/nocf‘ for this purpose and Nick Anderson (in the comments) came up with an even funnier name: ‘/COWBOY‘.

Thanks for all the nice feedback! 🙂

Today I figured out how to automatically add new devices (in my case those are mostly virtual machines) to the Zenoss monitoring system. This used to be done by hand, but no more 🙂

To add a new device (for example a Linux server called server001), simply call:

curl -u apiUser:apiPass \
'http://zenoss-server:8080/zport/dmd/DeviceLoader? \
deviceName=server001&devicePath=/Server/Linux&\
loadDevice:method=1'

It’s wise to create a dedicated Zenoss user just for these API calls, but you may use any account that has sufficient permissions to perform the action you’re calling.

As an alternative you can also use the ‘zenbatchload‘ command. Although you can only add new devices, not edit existing ones.The RESTful API does have the possibility to edit an existing device.

Let’s set some properties to the server we’ve just added:

curl -u apiUser:apiPass \
'http://zenoss-server:8080/zport/dmd/Devices/Server/\
Linux/devices/server001/manage_editDevice?serialNumber=1234&\
tag=tagname&productionState=1000&\
groupPaths=Group1&groupPaths=Group2&priority=3&\
comments=Api%20Test%20Comment&systemPaths=/System\
&rackSlot=Virtual'

It took me some time to figure out all available attributes, although once I found some of them I was able to Google the full list with an explaination.

Attributes:

  • deviceName – the name or IP of the device. If its a name it must resolve in DNS
  • devicePath – the device class where the first “/” starts at “/Devices” like “/Server/Linux” the default is “/Discovered”
  • tag – the tag of the device@
  • serialNumber – the serial number of the device
  • zSnmpCommunity – snmp community to use during auto-discovery if none is given the list zSnmpCommunities will be used
  • zSnmpPort – snmp port to use default is 161
  • zSnmpVer – snmp version to use default v1 other valid values are v2
  • rackSlot – the rack slot of the device.
  • productionState – production state of the device default is 1000 (Production)
  • comments – any comments about the device
  • hwManufacturer – hardware manufacturer this must exist in the database before the device is added
  • hwProductName – hardware product this must exist in the manufacturer object specified
  • osManufacturer – OS manufacturer this must exist in the database before the device is added
  • osProductName – OS product this must exist in the manufacturer object specified
  • locationPath – path to the location of this device like “/Building/Floor” must exist before device is added
  • groupPaths – list of groups for this device multiple groups can be specified by repeating the attribute in the url
  • systemPaths – list of systems for this device multiple groups can be specified by repeating the attribute in the url
  • statusMonitors – list of status monitors (zenping) for this device default is “localhost”
  • performanceMonitor – performance monitor to use default is “localhost”
  • discoverProto – discovery protocol default is “snmp” other possible value is “none”

Finally, in case you wish to delete a device, that can be done as well:

curl -u apiUser:apiPass \
'http://zenoss-server:8080/zport/dmd/Devices/Server/Linux/\
devices/server001/deleteDevice'

Personally I prefer not to delete devices. I rather set the ‘productionState’ to ‘-1’ (Decommissioned) to keep the history in Zenoss.

These simple API calls make it possible to automatically add a new server to the monitoring, or sync information from another source. But you can use the API for gathering all sorts of data as well. For example the load-average:

curl -u apiUser:apiPass \
'http://zenoss-server:8080/zport/dmd/Devices/Server/Linux/\
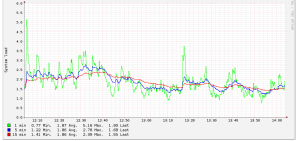
devices/server001/getRRDValue?dsname=laLoadInt5_laLoadInt5'

Result:

2.0

If you want to start playing with it, have a look at the Zenoss API documentation.

Het leuke van publiceren waar je mee bezig bent is dat je feedback krijgt. Dat gebeurde ook met mijn korte stukje over Dstat gisteren. Reacties van een oud collega en collega beheerder hier uit Leiden. Leuk!

Pim tipte me Collectd: een daemon die allerlei statistieken verzamelt over een systeem en dit opslaat in RRD files. Helemaal leuk werd het toen hij erbij vertelde dat hij er zelf een front-end bij gemaakt heeft: Collectd Graph Panel (OpenSource). Gaaf!

Meteen maar eens uitgeprobeerd en het is allemaal simpel in te regelen en mooi om te zien.

Collectd installeren

aptitude install collectd

Ook Collectd Graph Panel is eenvoudig: tar downloaden, uitpakken, config nalopen en gaan! Het overzicht is wat prettiger dan onze oude Zabbix implementatie.

Diederik tipte Munin, dat ziet er interessant uit. Die tool ga ik binnenkort ook eens goed bekijken.

Waarom?
Monitoringtools (er zijn er vele) gebruik ik dagelijks om een goed beeld te houden op de verschillende systemen die we hebben draaien. Omdat er een nieuwe hardware/virtualisatie rivisie aankomt wil ik een goed beeld krijgen van de capaciteit die nodig is om alles vlekkeloos te laten lopen. Dit is ook het moment om de vergelijking met de cloud te maken. Deze tools helpen daar heel goed bij!

Vandaag een nieuwe tool ontdekt voor monitoren van de performance van Linux systemen: Dstat.Tot voor kort met vmstat bezig geweest. Dstat combineert vmstat met iostat, ifstat, netstat en meer. Alles bij elkaar in 1 oogopslag.

Dstat is een mooie tool waarmee je snel inzicht hebt. De output kan in een csv-file opgeslagen worden. Dit opent allerlei deuren om de data te analyseren.

Installeren is eenvoudig:

aptitude install dstat

Gebruik:

dstat –output dstat.log -d -m -p -g -s -n -N eth0,eth1 -c -C 0,1,2,3 5

Dit geeft elke 5 seconden een logregel in het csv-bestand.

Mooie grafieken kun je op deze pagina maken door je csv-file te uploaden. Maar voor wie wil kan er ook zelf iets van maken in OpenOffice 😉