Category: Linux Sysadmin

77 posts

When working in shells, it’s very useful to have syntax highlighting. In vim it’s just ‘:sy on’ and you’re done. For those of you using GNU Nano, I’ll show you how to enable syntax highlighting as well.

To start, we’ll need some files which tell nano what to display in what color. Here is an example of such a file for PHP:

nano /usr/share/nano/php.nanorc

syntax “php” “.php|.inc$” color white start="<?(php)?" end="?>" color magenta start="<[^?]" end="[^?]>" color magenta “$[a-zA-Z_0-9]” color brightblue “->[a-zA-Z_0-9]” color cyan “([)|(])” color brightyellow “(var|class|function|echo|case|break|default|exit|switch|if|else|elseif|@|while|return|public|private|proteted|static)\s” color brightyellow “&lt;(try|throw|catch|operator|new)&gt;” color white “=” color green “[,{}()]” color green “==” color brightgreen “(’[^’]’)|("[^”]")" color yellow start="" color yellow start="/*" end="*/" color yellow start="#" end="$" color yellow “//.*"

Then we tell nano where this file is to be found:

nano /etc/nanorc

And add this line:

## PHP
include "/usr/share/nano/php.nanorc"

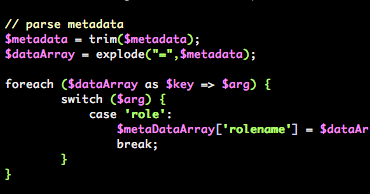
You then should see this when editing a PHP file with nano:
You can do the same for Bash files. Here’s the config file:

nano /usr/share/nano/sh.nanorc

syntax “sh” “.sh$” icolor brightgreen “^[0-9A-Z_]+()” color green “&lt;(case|do|done|elif|else|esac|exit|fi|for|function|if|in|local|read|return|select|shift|then|time|until|while)&gt;” color green “({|}|(|)|;|]|[|`|\|$|<|>|!|=|&||)” color green “-[Ldefgruwx]&gt;” color green “-(eq|ne|gt|lt|ge|le|s|n|z)&gt;” color brightblue “&lt;(cat|cd|chmod|chown|cp|echo|env|export|grep|install|let|ln|make|mkdir|mv|rm|sed|set|tar|touch|umask|unset)&gt;” icolor brightred “${?[0-9A-Z_!@#$?-]+}?” color cyan “(^|[[:space:]])#.$” color brightyellow “”(\.|[^”])"" “’(\.|[^’])’” color ,green “[[:space:]]+$"

It’s pretty easy to customize if you want. So now you never have to edit scripts without syntax highlighting again!

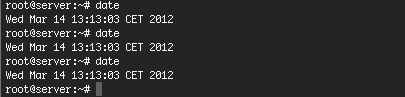
We still have some older hardware running for non-critical and lightweight operations. Since upgrading these old boxes to Debian Squeeze weird things started to happen. After some time, the system clock stops working and that results in processes to crash and new ones unable to start. Of course, nothing works properly on any computer without a working system clock. Here you see how that looks like:

First thought was to replace the CMOS battery, but that didn’t help and it occurred on multiple machines around the same time. Rebooting solves the problem for a while but 24-36 hours later the system clock stops again. Sometimes the problem stays away much longer. Also, some servers with the same hardware do not seem to have the problem. It seems hardware related. But is that really true?

Since the server crashes it is kinda hard to figure out what exactly happens. Logs aren’t properly written anymore and system processes are unreliable. Sometimes it is possible to access the server via SSH, sometimes it isn’t.

Today this happened again with one of our servers. Fortunately I was able to SSH into the machine and I found this warning in the logs:

Mar  14 13:00:05 server kernel: [97383.660485] Clocksource tsc unstable (delta = 4686838547 ns)

TSC is the Time Stamp Counter. Processors have dynamically changed clock speed (ofc to save power). The TSC is supposed to tick at the CPU rate so on frequency change, this ought to happen. The kernel will automatically switch to something else. This is true for modern hardware, this old CPU is set to constant_tsc (when using cat /proc/cpuinfo it’s one of the flags). It is thus supposed to run at the same frequency at all times.

The system might have multiple available clock sources. You can list the available clock sources in a system like this:

cat /sys/devices/system/clocksource/clocksource0/available_clocksource

On my system this returns:

tsc acpi_pm jiffies

To see which one is actually in use, issue:

cat /sys/devices/system/clocksource/clocksource0/current_clocksource

On my system this returns:

tsc

So this tells me I’m using ‘tsc’ as a Clock Source, and my system has two more options. Since I’m having trouble with ‘tsc’, let’s change the Clock Source from ‘tsc’ to ‘acpi_pm’.

echo acpi_pm > /sys/devices/system/clocksource/clocksource0/current_clocksource

Verify the new setting like this:

cat /sys/devices/system/clocksource/clocksource0/current_clocksource

It should now return ‘acpi_pm”.

This can be done at run time, when you reboot the setting is lost. It is a great way to test the setting. To make it permanent, add this line to the boot parameters in /boot/grub/menu.lst:

notsc clocksource=acpi_pm

I’ve just changed this on the server and I’m really curious whether this will be the solution to prevent the hangs! At least the time is still ticking.. 😉

If anyone has more suggestions or info, please let me know! I’ll keep you posted.

Update: Just reached 4 days of uptime!

Update 2: Today it’s 4 month’s after I wrote this blog. The machine is still up & running and has reached 106 days of uptime!

Update 3: After 7 months (222 days of uptime) I finally retired the machine since we migrated to our CloudStack cloud. The fix described above really works 🙂

HOWTO backup an OpenLDAP server

— 10,135 views — No comments

In a previous post I described howto restore a OpenLDAP server from backup . But how to backup Open LDAP?

The backups I make consist of two parts:

1. First backup the LDAP database itself using a program called ‘slapcat.’ Slapcat  is  used  to generate an LDAP Directory Interchange Format (LDIF) output based upon the contents of a given LDAP database. This is a text version of your database which can be imported later. Think of it as a SQL-backup for relational databases. Anyway, here’s how to run slapcat on the OpenLDAP server:

slapcat -l backup.ldif

This will backup the whole database into the file called ‘backup.ldif’. You can then use this file to restore an OpenLDAP server later, using slapadd. Be sure to run this in a backup script from crontab and have a backup at least once per day.

2. Second thing I do, is backing up the config of the OpenLDAP server. This config is usually in /etc/ldap. Back it up using a tar, or using a technique like rsnapshot.

When you have this in place (and save the backups on a different place), you’ll be able to rebuild an OpenLDAP server without problems.

Loads of sleeping MySQL connections?

— 3,536 views — No comments

Then probably the code is not properly disconnecting the MySQL connection. The time MySQL waits for the next command to be send, can be controlled by the ‘wait_timeout’ parameter. The default is a massive 28800 seconds (8h). Setting this value too low gives ‘MySQl server has gone away’ errors, so be careful.

Debugging scripts that create many ‘sleeping’ connections is challenging. An easy solution is setting the ‘wait_timeout’ parameter to something low after the MySQL connection is started. This setting is then valid only for this current session.

Issue this query after every connect:

SET wait_timeout=60;

Database administrators can permanently change this setting in ‘/etc/mysql/my.cnf’ or by issuing a

SET GLOBAL wait_timeout=60;

to change it during runtime. Don’t forget to edit ‘my.cnf’ also, otherwise the setting is back to default the next time MySQL restarts.

After restoring an OpenLDAP server I found these lines in the logs:

Mar  5 06:50:03 ldap slapd[4815]: <= bdb_equality_candidates: (uidNumber) index_param failed (13)
Mar  5 06:50:04 ldap slapd[4815]: <= bdb_equality_candidates: (uid) index_param failed (13)

This means OpenLDAP is query’ing its database, but found no index for fields it often uses. In this case ‘uid’ and ‘uidNumber’. It seems due to restoring the backup, these indexes got lost. Here is how to add the indexes again:

Stop the OpenLDAP server:

/etc/init.d/slapd stop

Open the config file where we’ll add the indexes:

vim /etc/ldap/slapd.d/cn\=config/olcDatabase\=\{1\}hdb.ldif

Add the new indexes, after the first ‘olcDbIndex: objectClass eq in’ line. In my case this was in the file:

...
olcDbIndex: objectClass eq
...

And I changed that to:

...
olcDbIndex: objectClass eq
olcDbIndex: uid eq
olcDbIndex: uidNumber eq
olcDbIndex: uniqueMember eq
olcDbIndex: gidNumber eq
...

Be sure not to touch other settings in that file. Just add the lines after the first index. After that, make sure to reindex the database:

slapindex -F /etc/ldap/slapd.d/

Since I ran that as root user, I need to fix permissions afterwards:

chown -R openldap:openldap /var/lib/ldap

Make sure when you do a ‘ls -la’ on /var/lib/ldap, all files (including the folder itself) are owner and group ‘openldap’, otherwise OpenLDAP will not start.

Now it’s time to start OpenLDAP again:

/etc/init.d/slapd start

And all should be well again! When it does not start and look like this:

PANIC: fatal region error detected; run recovery

Be sure to check the permissions as stated above!

Just a quick instruction on howto restore an OpenLDAP server using a ‘ldif’-backup-file:

1. Setup the server

2. Configure the ‘slapd’ package, be sure to use the right database name. It’s a bit confusing: you enter it as ldaptree.company.com, but this will be used to create an empty database. Make sure it matches your backup ldif structure.

3. Make sure OpenLDAP is stopped

4. Read the backupdata into the OpenLDAP database using slapadd program

slapadd -c -l backup.ldif

The -c continues on errors, which might be necessary for example because the ‘root’ is already created. You can also run without it, and fix any errors by hand in the backup.ldif file. -l specifies the file to read from.

5. Fix permissions, make sure ‘openldap’ is both user/group owner

6. Start OpenLDAP and the server should be up & running again!

Perl processes that got stock kept me from sleep last night. I’m not sure what happened, but probably they were waiting for the database that reached a max_connections limit for this particular user. When Apache reached its max processes, monitoring paged me. Fortunately this is all running in a cluster, so no service was interrupted.

A few days ago I found myself killing Apache processes from a user that created an endless loop. Also, some scripts our users upload generate a lot of load (which is ok for a while, but not too long). So I thought I’d write something in bash to help me with all this 🙂

The script below is what I’ve come up with so far and it seems to work pretty well. What it does, is allowing user processes to run for 10 minutes and then kick in and kill the process if it’s still there.

Apache processes are running as the owner of the account (using mod_ruid) so I can actually see to what user the Apache processes belong. Perl, of course, is also run as the account user. Making use of this is the base idea of the script. Sample ‘ps aux’:

user1        24891  1.1  1.8 112132 61000 ?        S    18:54   0:02 /usr/sbin/apache2 -k start
www-data     24894  0.1  0.8  82624 30240 ?        S    18:54   0:00 /usr/sbin/apache2 -k start
user2        24900  0.2  0.9  82984 31552 ?        S    18:54   0:00 /usr/sbin/apache2 -k start
www-data     25201  4.8  1.2  95540 43296 ?        S    18:57   0:00 /usr/sbin/apache2 -k start
www-data     25202  1.0  0.8  82972 30016 ?        S    18:57   0:00 /usr/sbin/apache2 -k start
user2        25213  6.0  0.1   8992  5692 ?        S    18:57   0:00 /usr/local/bin/perl -- /var/www/site.com/HTML/script.cgi

For safety, I ignore FTP (pure-ftp in my case) and SSH processes. And of course only UID’s from 1000 and up are taken into account. So the ‘www-data’ processes never gets killed’; ‘user1’ and ‘user2’ processes will be killed when they do not complete within 10 minutes.

#!/bin/bash

2012-03-04, remi: Kill processes from users (id 1000 and up) that have been running for more than 600 seconds

For safety, I exclude some processes that users might run that are OK (ftp,ssh,etc)

get processes

ps -eo uid,pid,cmd:9,lstart –no-heading |     tail -n+2 |     # we never want to kill pure-ftp     grep -v “pure-ftpd” |     #  nor sshd     grep -v “sshd” |     #  nor bash     grep -v “bash” | # ignore all sbin processes, incl Apache     grep -v “/usr/sbin” |     # loop remaining processes     while read PROC_UID PROC_PID PROC_CMD PROC_LSTART; do         # only interested in user processes, so ignore system processes         if [ $PROC_UID -ge 1000 ]; then                 # how long is this process running?                 SECONDS=$[$(date +%s) - $(date -d"$PROC_LSTART" +%s)]                 # 600 seconds should be more than enough                 if [ $SECONDS -gt 600 ]; then                         # now, output pid’s to be killed on the final line of this script                         echo $PROC_PID                         # do save log for debugging                         cat /proc/$PROC_PID/cmdline >> /var/log/killed.log 2>&1                         echo “, details: " >> /var/log/killed.log                         date >> /var/log/killed.log                         ls -la /proc/$PROC_PID/ >> /var/log/killed.log 2>&1                 fi         fi      done |      # finally, kill them!      xargs kill

Problems occur when the ‘cmd’ argument has spaces. Since the script delimiters its parameters by spaces also, a syntax error occurs. I worked around that by limiting the output to only 9 characters ‘cmd:9’. In my specific case that did the trick but I’d like to know if there’s a better way to handle it 🙂

Just run this script from cron every minute:

* * * * *  /usr/local/bin/killSlowUserProcesses.sh > /dev/null 2>&1

I hope this will bring me a good night’s sleep tonight 😉

Update: I’ve disabled killing of Apache processes since mod_ruid switches users around including back/forth to www-data. The process might be running for some time, it is not certain the current user has been running it all the time. I need to think about this one for some more time 😉 Updated the above script, added this line:

    grep -v "/usr/sbin" |

CloudStack 3.0 released today!

— 122 views — No comments

Good news today when I came home from the office: CloudStack 3.0 stable has been released! I’d really been looking forward to this, because we’ll be using it in a big cloud project at work. With this release, we can finalize our cloud design and proof-of-concept setup. More about that later.

Thanks to the CloudStack team for this great release! 🙂

Redirecting incoming tcp connections with redir

— 4,457 views — 5 Comments

Sometimes you need an easy way to redirect incoming connections to another system. For example when migrating an old box to a new one. Today I came across an old note from myself explaining this. I thought it might be worth sharing 🙂

You’ll need the ‘redir’ program for this to work:

apt-get install redir

Redir redirects tcp connections coming in to a local port to a specified address/port combination like this:

redir –laddr=10.10.0.1 –lport=80 –caddr=10.10.10.1 –cport=80

This redirects web requests coming in at 10.10.0.1 to 10.10.10.1.

redir –laddr=10.10.0.1 –lport=21 –caddr=10.10.10.1 –cport=21 –ftp=both

And here the same for ftp. Note the –ftp option, this makes sure both passive and active ftp work.

Many years ago, when I didn’t know about this option, I had to rollback an upgrade in the middle of the night, because ftp redirection just didn’t work.. all I had to do was add –ftp=both to redir. I found it out the next morning, and did the upgrade again the following night. I’ll never forget! Just had to smile when I found the note today 🙂

CloudStack from an end-user’s point of view

— 6,872 views — No comments

For a Cloud project at work, I made some screenshots of CloudStack to show our management. They wanted to know what an end-user will see in CloudStack 3.0. This is CloudStack from an end-user’s point-of-view:

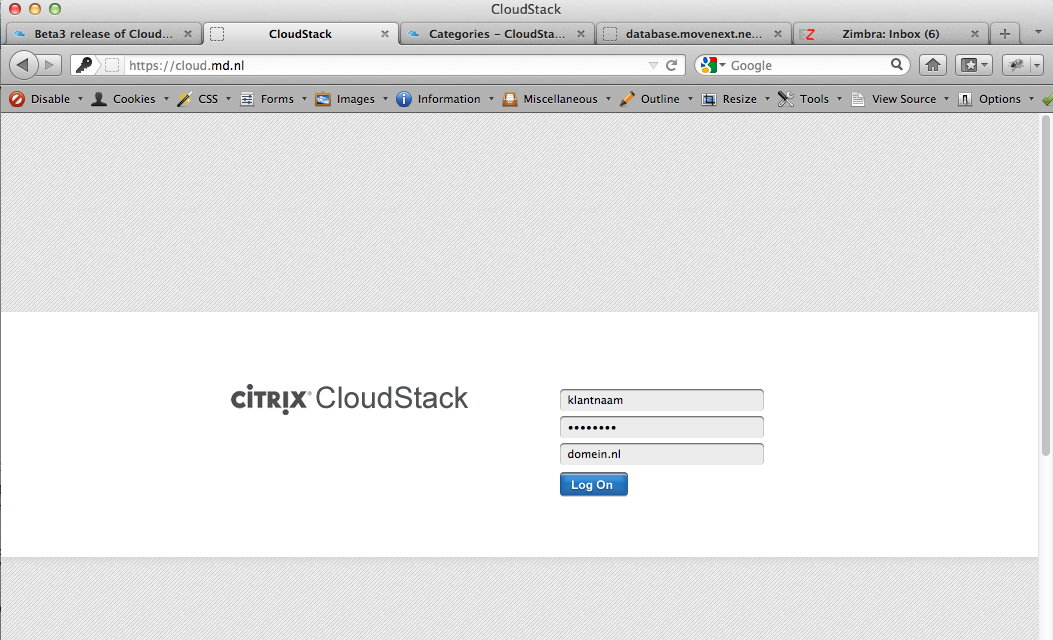
The login screen is where it all starts..

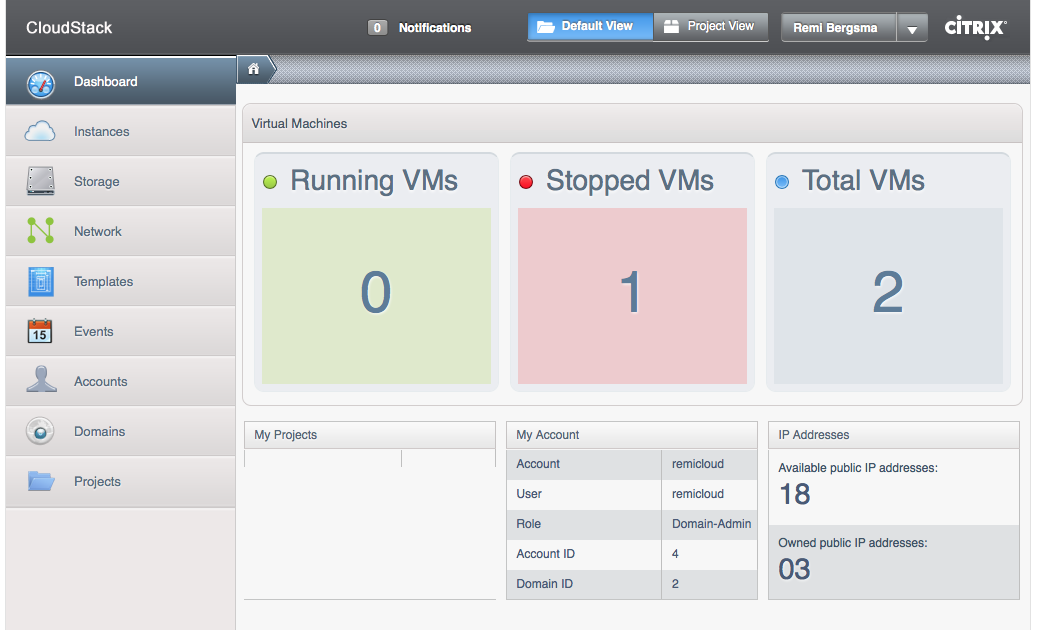
After logging in, users are presented with a Dashboard. Here is a nice and clear overview of what VM’s are running and stopped. As you can see, there is a nice menu at the right.

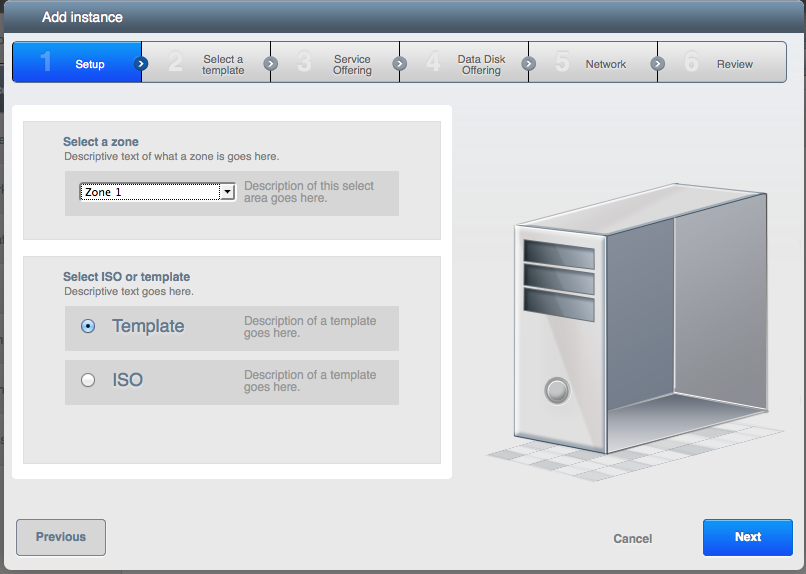
New VM’s can be added to CloudStack using a Wizard. The first step is to choose between a template (which is a pre-made server installation) or an ISO (which is more like booting an installation CD). Here we choose Template.

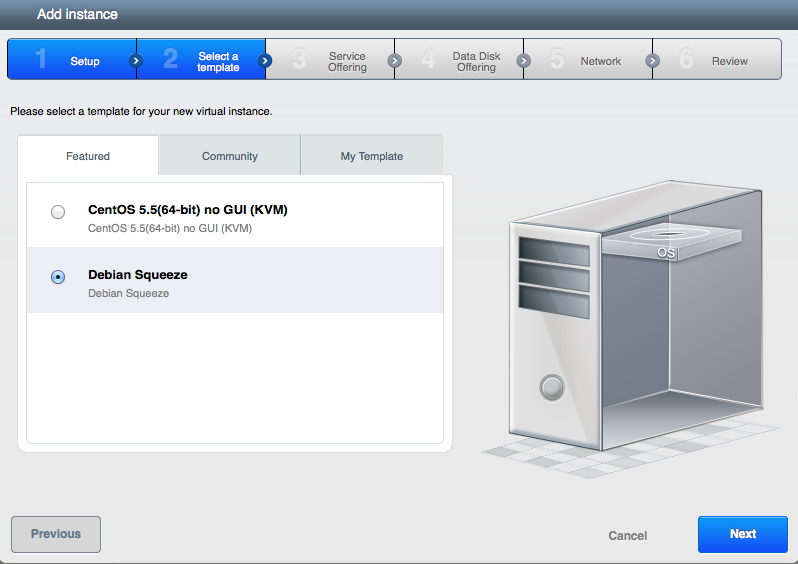
All available templates are presented to the user. We can choose between CentOS and Debian. Of course, any OS can be added as template. We select Debian here.

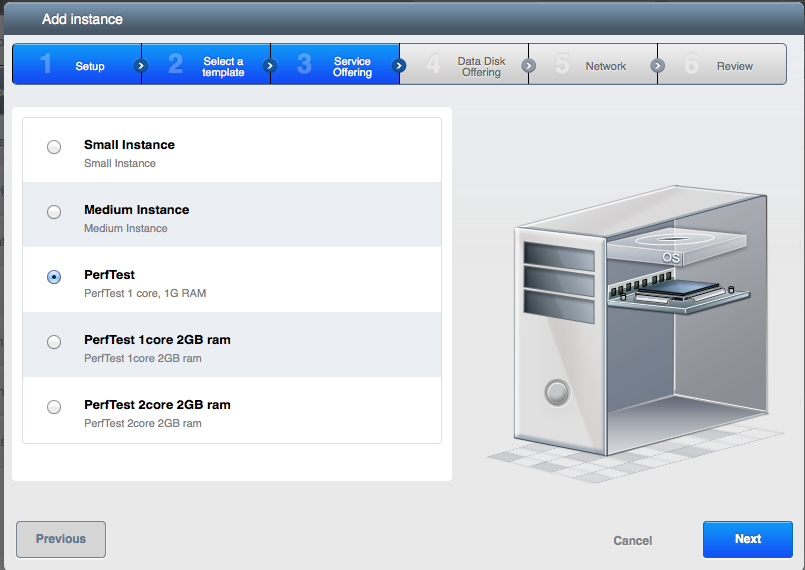
Now that we have selected a template, CloudStack wants to know what CPU and RAM the new VM should have. The user selects one of the pre-set options. It is also possible to present a price on this page, so the user knows what he will be billed for.

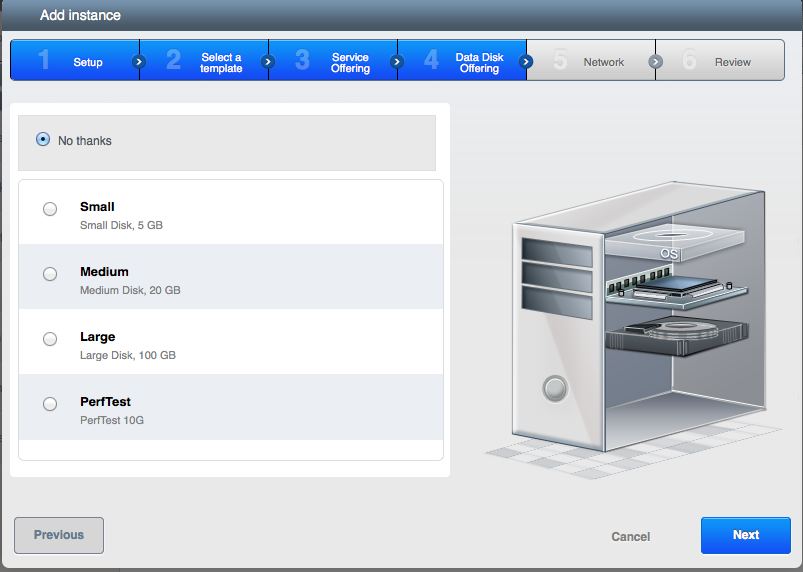
As an optional step, an additional data-disk can be added. This disk can later be detached from this VM, and attached to another. This way data can travel between VM’s.

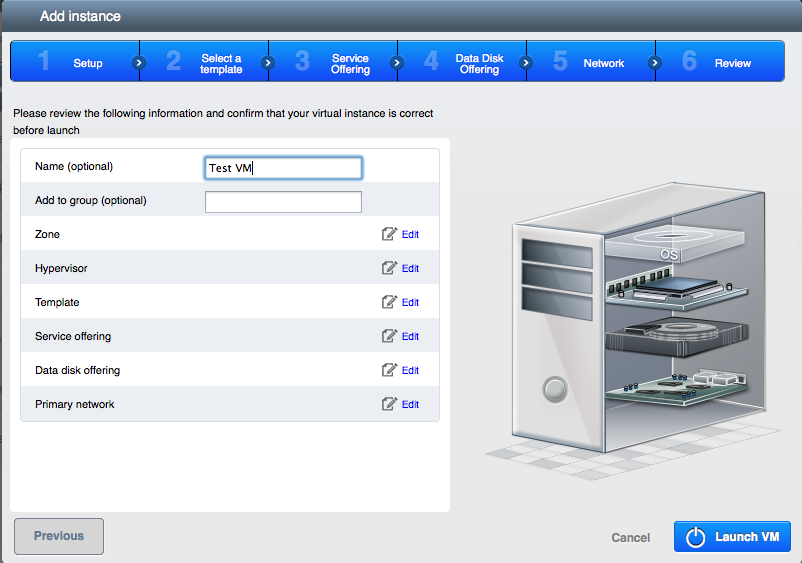
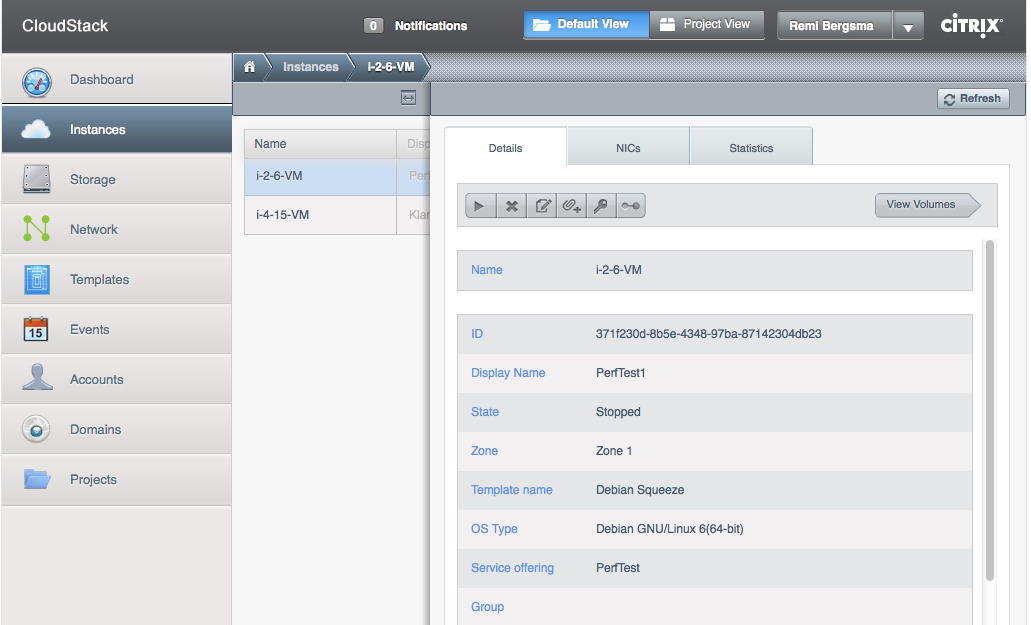
The final step is to give this VM a name and the Launch it! CloudStack will keep you posted about the status. Soon you will receive a message on screen noting the VM is running. In the menu you select Instances (that is what VM’s are called). When you select a given VM, you see a page with all of its settings. Have a look at the screenshot below.

This page shows the details of the VM. Different options are available when the VM is running or stopped etc. When not running, you can upgrade its service offering for example to a more powerful CPU or more RAM. When running, you can connect to the console to manage the VM through that.

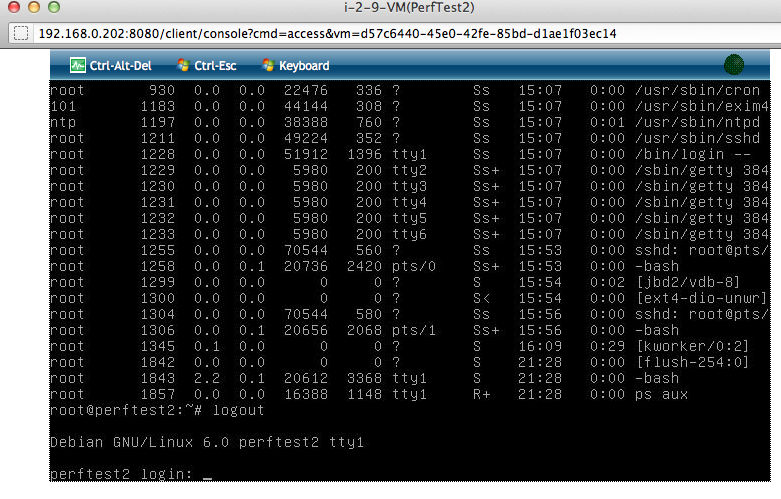
Working on the console (via a browser) looks like this. This is handy when you need to change the network options, or when a VM has a problem. Otherwise, working via a SSH-shell should be easier.

As you can see the CloudStack UI looks pretty nice! Not only is this a great product from a technical point of view, it also has a nice interface for users without a technical background.

CloudStack 3.0 is currently in beta and should be released any time soon.

Update: CloudStack 3.0.0 has been released. The screenshots look almost the same. Two differences:
1. On the login-page you now can choose between English and Japanese language
2. The ‘System’ menu on the left is renamed to ‘Infrastructure’, which indeed is a better name!